
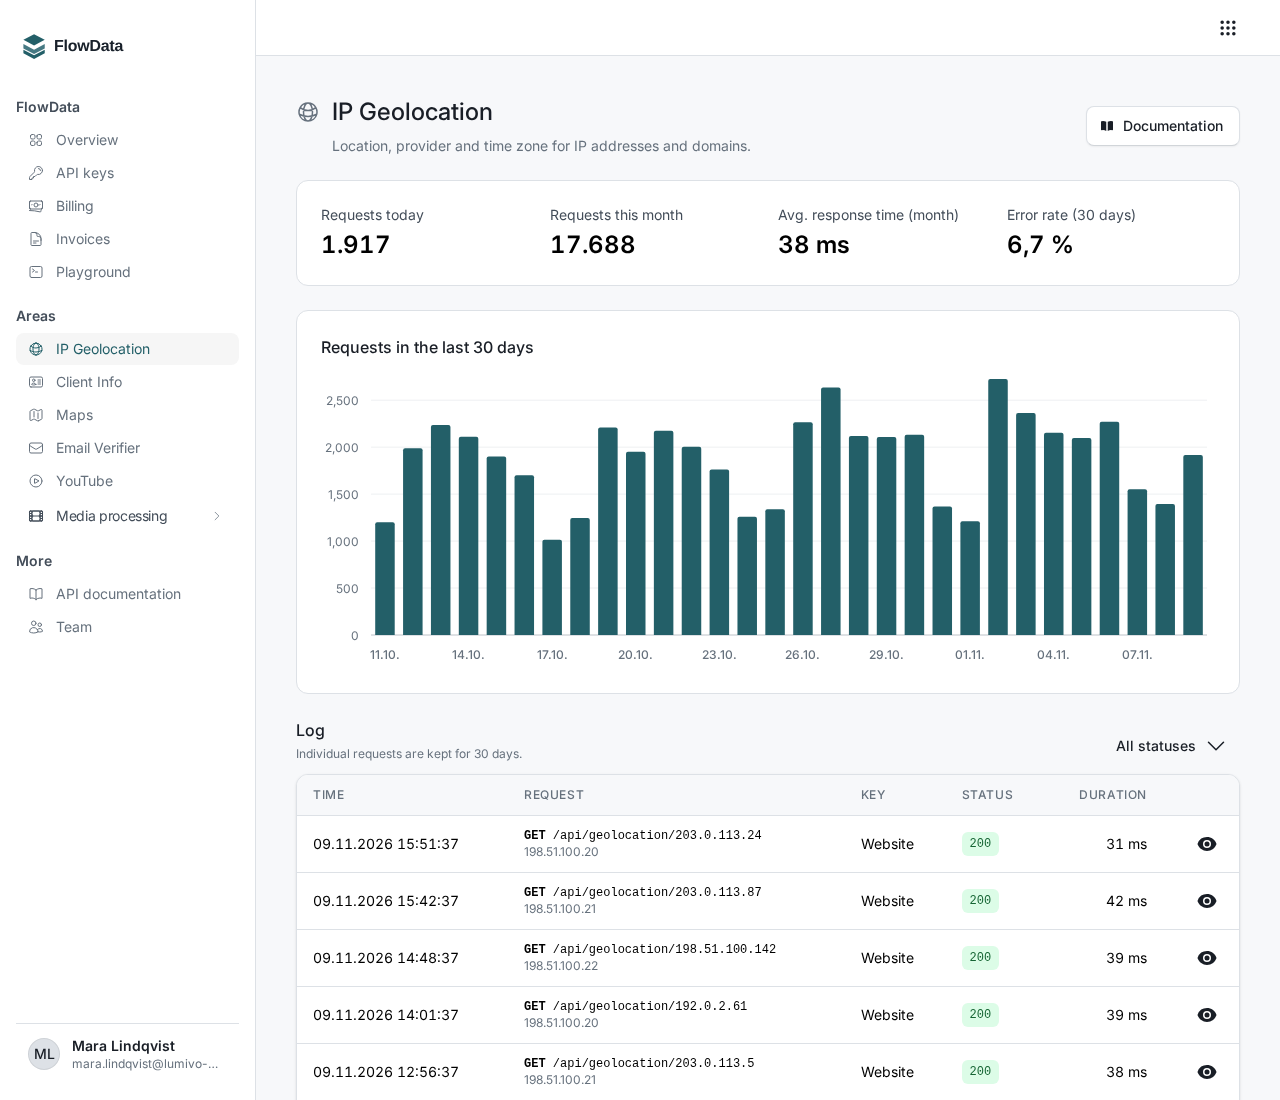
Every FlowData area has its own page with metrics, a 30-day history and a log of individual requests. This lets you see quickly whether your integration is running cleanly and find failed requests without digging through your own server logs.
Opening an area
In the sidebar, under Areas, click the area you want, such as IP Geolocation or Maps. You can also click the matching tile on the Overview. Documentation at the top right takes you straight to the API documentation for that area.
The metrics
There are four values at the top:
- Requests today and Requests this month
- Avg. response time (month): how long FlowData took on average to answer during the current month
- Error rate (30 days): the share of requests with an HTTP status of 400 or higher
Below that, the chart Requests in the last 30 days shows the number of requests per day. All requests made with your team's keys are counted, regardless of which person or integration they came from.
The log
The Log lists every single request with Time, Request (method, path and calling IP address), Key, Status and Duration. Individual requests are kept for 30 days. The numbers in the metrics and the chart, on the other hand, are kept permanently.
To narrow down the list:
- Click All statuses and choose Successful or Failed.
- If your team uses several keys in this area, pick one under All keys.
- Use Reset filters to see everything again.
Looking at a request in detail
Click the eye icon (Show details) at the right of the row. The Request details dialog shows the IP address, the User agent, the Parameters that were passed and, for errors, the Error response, which is exactly what your software got back. Keys and passwords are not stored.
Common errors in the log
- 400: the request was invalid, for example an email address with an invalid format in Email Verifier.
- 401: no key or an invalid key. These requests can't be matched to a key, so they don't appear in your team's log.
- 402: the balance isn't enough or a spend limit has been reached.
- 403: the key isn't allowed to use this area, for example because its owner no longer has FlowData access.
- 422: a required parameter is missing or has the wrong format. The error response names the field.
- 429: too many requests in a short time. Wait a moment and retry with some spacing.
Errors and rate limits explains what to do in each case.
Good to know
- Requests made with an older FlowSuite key are marked FlowSuite key in the log. See Replacing FlowSuite keys for how to switch them.
- Media processing also has its own job list with status and outputs, see Media job status and errors.